Gathering feedback about easy-to-understand estimates of ground shaking during interactive online poll session on 6 May 2021
Part of the information to be presented on the TURNkey platform will be earthquake hazard maps and maps of shaking from actual earthquakes. The information should be easy to understand for end users and include uncertainty. End users are for example businesses, emergency responders and civil protection. “Easy-to-understand” generally means that the information is presented in a non-technical way.
The easy-to-understand estimates of ground shaking are being developed in Work Package 3. First ideas were presented to the work package participants in March 2021 during an online meeting. This resulted in the first draft of maps for the earthquake warning phases of Operational Earthquake Forecasting (OEF), Earthquake Early Warning (EEW), and Rapid Response to Earthquakes (RRE). In addition, graphs were made of estimates at points of interest, such as historical buildings, bridges, and hospitals.
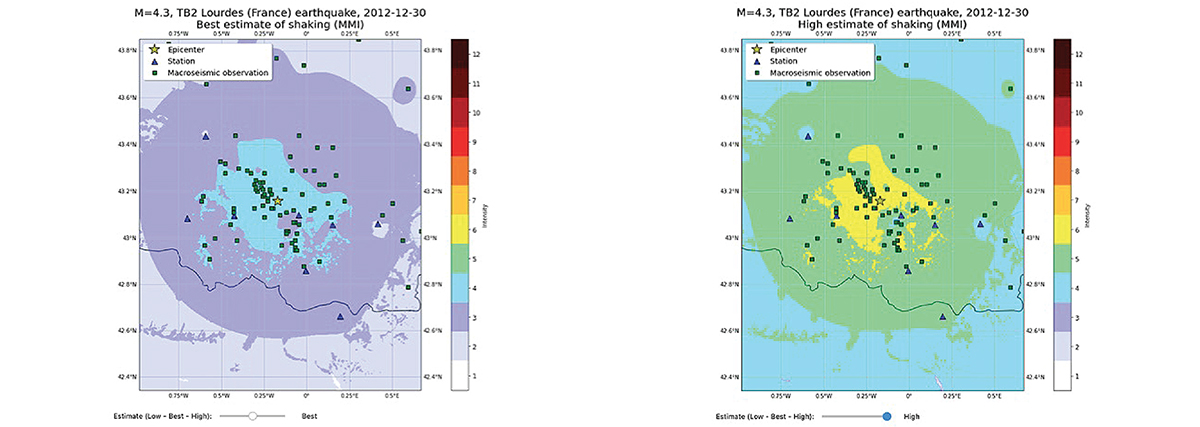
- Example of an RRE shakemap showing the best (left) and high (right) estimate of shaking using the macrointensity scale (source: BRGM).
.
Feedback on the drafts was gathered among the work package participants during an online interactive session on 6 May 2021. The application used for the online poll was Mentimeter. The visualisations were presented to the participants. Questions were asked about different aspects, such as the understandibility of titles, different options for colour scales, linear or logarithmic representation of the data, and the slider for low, best, or high estimates of shaking. The first question was in the form of a vote for a certain option. This voting question was always followed by a free-field question where participants could type any comments they wanted. Especially this second feature allowed people who would normally not speak up in a large group to give their feedback. Using the open questions also ensured that all comments were saved for later analysis. By way of example, below is a few feedback from participants and an open question from the survey.
“Thanks for this meeting, that was really a fantastic way to conduct it –
giving everybody the opportunity to express their opinion without
lengthy discussions. This was the most fun meeting I had in a long time!”
- Quote from one of the participants.
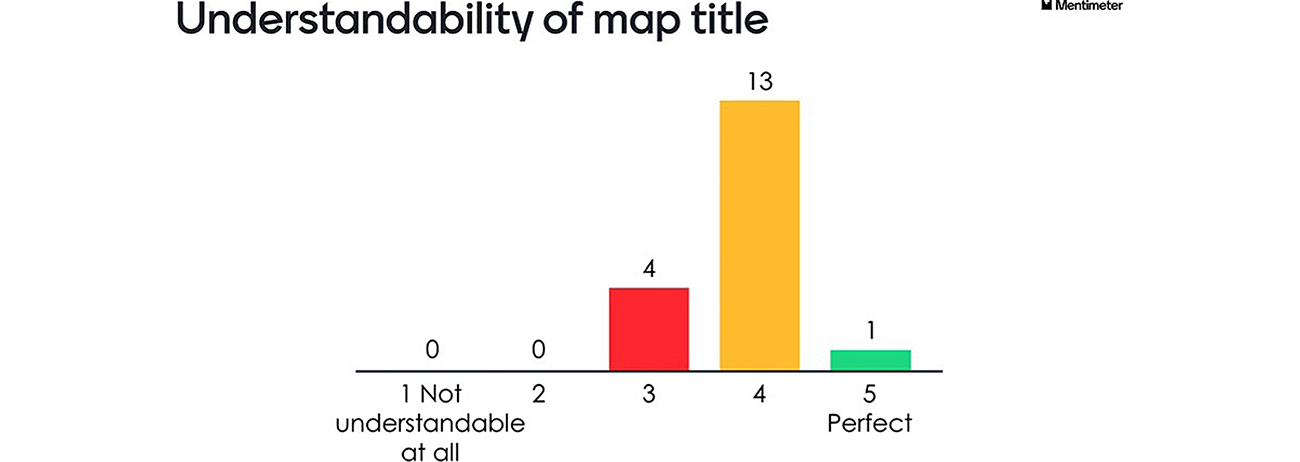
- Example of a voting question.
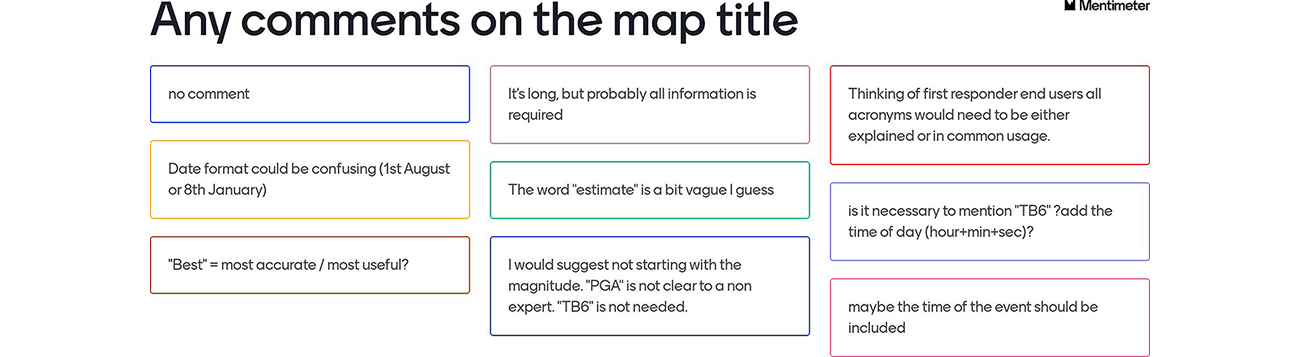
- Example of open question with suggestions for improvement.
The results of the poll will be used to make the final design of the visualisations, to be delivered to the platform. The final end user consultation will be done using the mock-up of the platform which will include the easy-to-understand visualisations of ground shaking. The improvements suggested by the end users can be incorporated in the final version of the platform.
For more details about the easy-to-understand estimates of shaking or how we conducted the online poll, please contact Pauline Kruiver (pauline.kruiver@knmi.nl).